Prime spiral
from matplotlib import pyplot as plt
import numpy as np
from sympy import isprime


upper_limit = pow(2, 17)
theta = []
r = []
ptheta = []
pr = []
def f(x):
    return (np.sqrt(x),x)
for i in range(1, upper_limit):
    res = f(i)
    r.append(res[0])
    theta.append(res[1])
    if isprime(i):
        pr.append(res[0])
        ptheta.append(res[1])

fig = plt.figure(figsize = (6,6))
ax = fig.add_subplot(111, projection="polar")
# ax.plot(theta, r, ".", alpha = 0.1) # if you want to plot all the number
ax.plot(ptheta, pr, "g.", alpha = 0.75)
plt.show()

(*) np.sqrt(x) in f(x) helps to make the distribution uniform.
Consider the area of a ring of raduis
Therefore
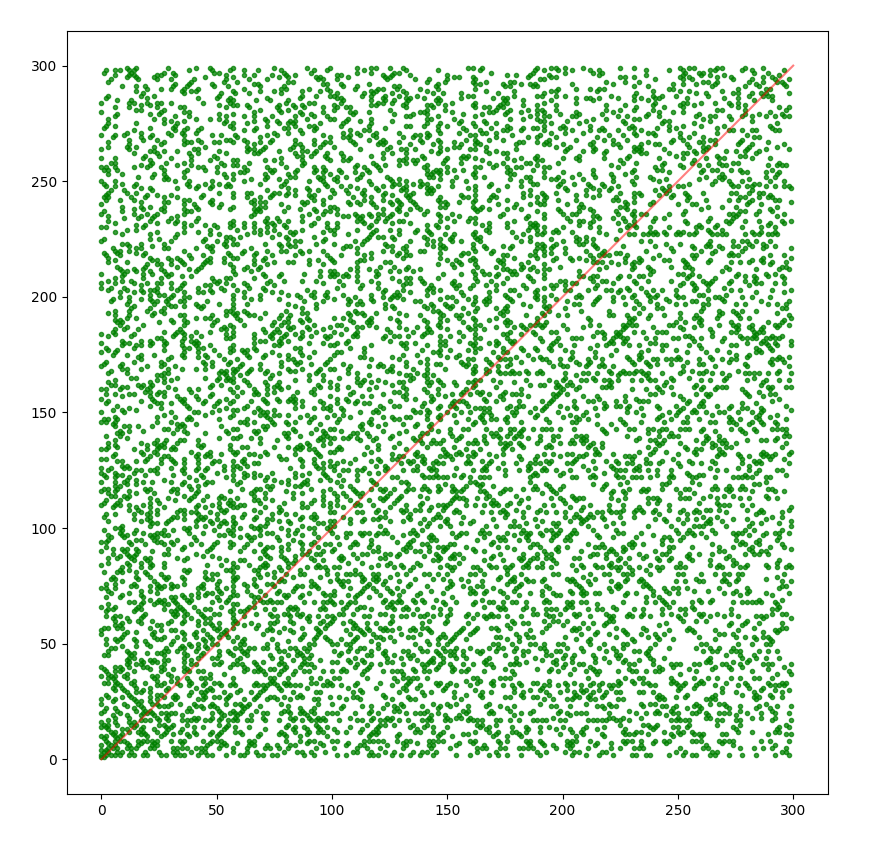
Ulam spiral
The Ulam spiral constructed by writing the positive integers like this way on a square lattice
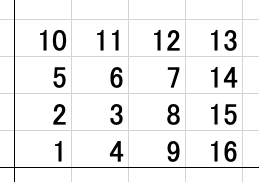
and then marking the prime numbers:

from matplotlib import pyplot as plt
import numpy as np
from sympy import isprime


upper_limit = 300
xs = []
ys = []
pxs = []
pys = []
def f(x, y):
    return (x+1)*(x+1) - y if x>=y else y*y + 1 + i
for i in range(upper_limit):
    for j in range(upper_limit):
        xs.append(i)
        ys.append(j)
        if isprime(f(i,j)):
            pxs.append(i)
            pys.append(j)
# plt.plot(xs, ys, ".", alpha = 0.1) # if you want to plot all the number
plt.plot(pxs, pys, "g.", alpha = 0.75)
plt.plot([0, upper_limit], [0, upper_limit], "r-", alpha = 0.5)
plt.show()