以前書いたブラックショールズモデルの関数を使って、権利行使までの時間と行使価格を動かしてグラフを描いてみようと思う。
swdrsker.hatenablog.com
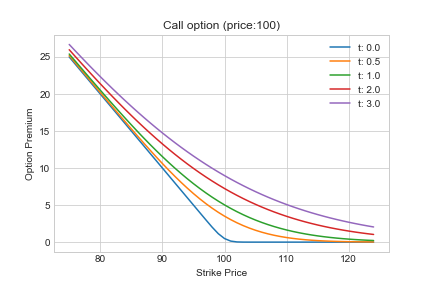
権利行使までの時間が長くなるほど緩やかな曲線になるのを見たい。
import numpy as np
from scipy import stats
import matplotlib.pyplot as plt
import seaborn
seaborn.set_style("whitegrid")

rf_rate = 0.005 #risk free rate (0.5%)
sigma = 0.12 #volatility (12%)
price = 100 #present value

def bs_model(S,x,r,sigma,T):
    d1 = (np.log(S/x) + (r + 0.5 * sigma ** 2)*T)/(sigma*pow(T, 1/2))
    d2 = (np.log(S/x) + (r - 0.5 * sigma ** 2)*T)/(sigma*pow(T, 1/2))
    call = S * stats.norm.cdf(d1) - x * np.exp(-r*T) * stats.norm.cdf(d2)
    put  = x * np.exp(-r*T) * stats.norm.cdf(-d2) - S * stats.norm.cdf(-d1)
    return call,put
リスクフリーレートは0.5%, ボラティリティは12%, 現在価格を100とした。
x = np.arange(75,125)
plt.figure()
for t in [0.01,0.5, 1,2,3]:
    bs = lambda x: bs_model(price,x , rf_rate, sigma, t)[1]
    plt.plot(x, np.vectorize(bs)(x), label="t: %1.1f"%t)
plt.xlabel("Strike Price")
plt.ylabel("Option Premium")
plt.title("Put option (price:100)")
plt.legend()

x = np.arange(75,125)
plt.figure()
for t in [0.01,0.5, 1,2,3]:
    bs = lambda x: bs_model(price,x , rf_rate, sigma, t)[0]
    plt.plot(x, np.vectorize(bs)(x), label="t: %1.1f"%t)
plt.xlabel("Strike Price")
plt.ylabel("Option Premium")
plt.title("Call option (price:100)")
plt.legend()

行使価格が高いほど、Put option(売る権利)の価値が高くなる。
行使価格が低いほど、Call option(買う権利)の価値が高くなる。
権利行使までの時間が長いほど滑らかな曲線になることがわかる。
ATM付近でのセータの変動の様子もなんとなくわかる。